figure3_a
-

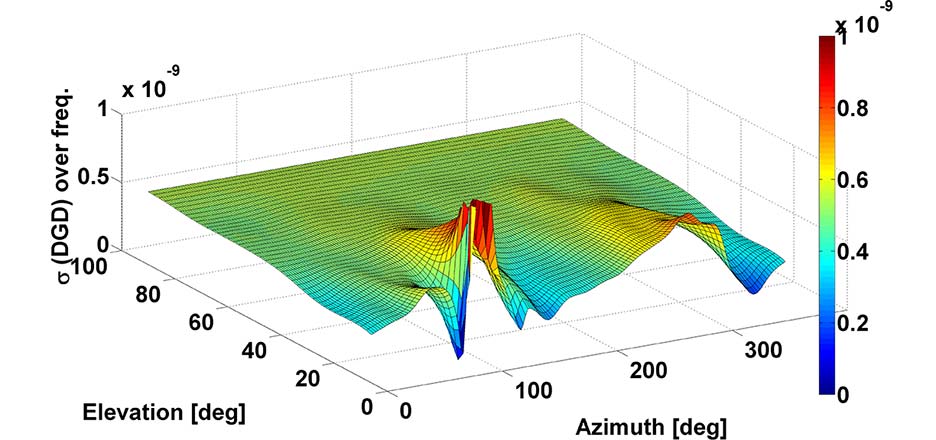
Figure 3a. 3D standard deviation (calculated over frequency) of the DGD for a) single-feed antenna. Source: Stefano Caizzone, Mihaela-Simona Circiu, Wahid Elmarissi, Christoph Enneking, Michael Felux and Kazeem A. Yinusa, German Aerospace Center (DLR)
Source: Stefano Caizzone, Mihaela-Simona Circiu, Wahid Elmarissi, Christoph Enneking, Michael Felux and Kazeem A. Yinusa, German Aerospace Center (DLR)


Subscribe to GPS World
If you enjoyed this article, subscribe to GPS World to receive more articles just like it.


Follow Us