No audio available for this content.
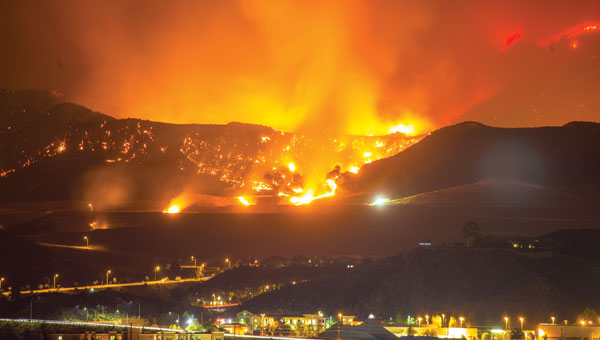
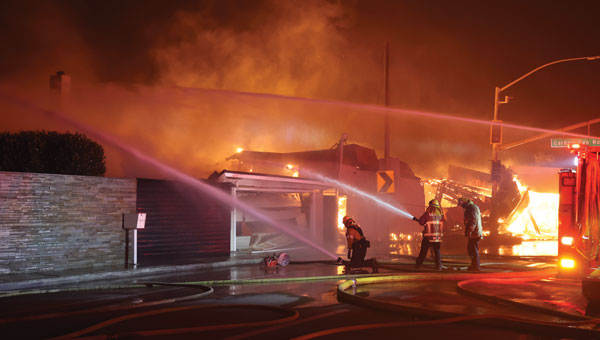
The Palisades and Eaton fires devastated parts of Los Angeles in January 2025 and are largely contained as of Jan. 20. Fueled by extreme Santa Ana winds and dry conditions, these fires have left a mark on the region’s landscape and community.
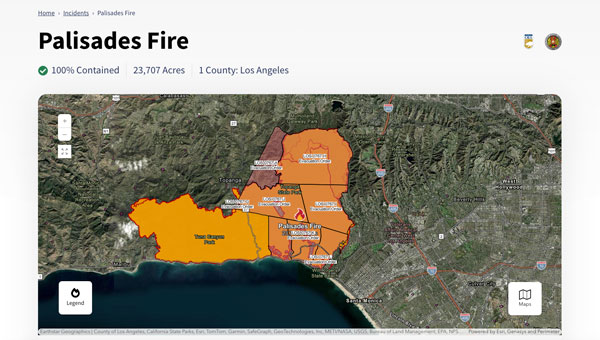
The Palisades Fire, which originated in the Pacific Palisades on Jan. 7, ultimately burned 23,448 acres, resulted in 12 confirmed fatalities and destroyed or damaged more than 6,800 structures, according to the California Department of Forestry and Fire Protection, known as CAL FIRE. The fire’s rapid expansion was particularly alarming, growing from a small brush fire to a massive conflagration within an hour.
Simultaneously, the Eaton Fire, which began near Altadena and Pasadena, consumed 14,117 acres. This fire proved even more deadly, with 17 confirmed fatalities and significant damage to more than 10,000 structures, according to CAL FIRE. Both the Palisades and Eaton fires have now been classified among the most destructive wildfires in California’s history.
During times of emergency, geographic information systems (GIS) specialists come together to create real-time mapping tools to provide critical support to first responders and keep communities well-informed. These tools have become indispensable in modern disaster management, particularly in wildfire response.
Interactive 3D Maps
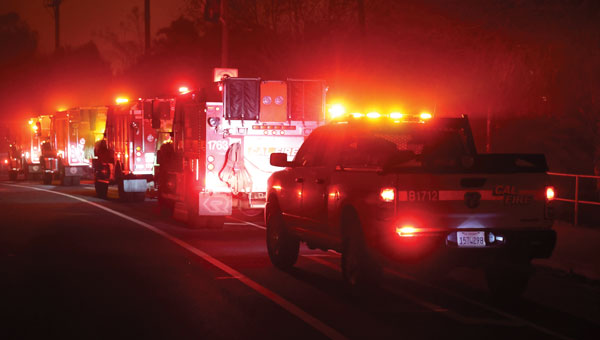
Firefighters and other specialists from federal, state, and local agencies work together to fight wildfires. GIS specialists develop interactive 3D maps to display fire perimeters, evacuation zones and other critical data. The geospatial data serves as the foundation for effective communication and decision-making, allowing firefighters and incident management teams to access information in near real-time to make informed decisions.
Fire GIS specialists Peter Rowland, Brett Adler and Dawn Hutchinson shared insights into their teams’ strategies for wildfire management. They emphasize the crucial role of geospatial tools in disaster response by delivering actionable intelligence. GPS World interviewed them during the California wildfires. Rowland and Adler were based at the Palisades fire, while Hutchinson, who is a member of a California Interagency Incident Management Team (CIIMT), was located near the Eaton fire.
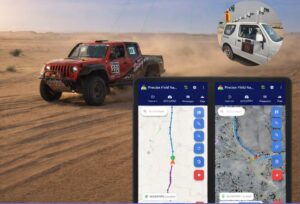
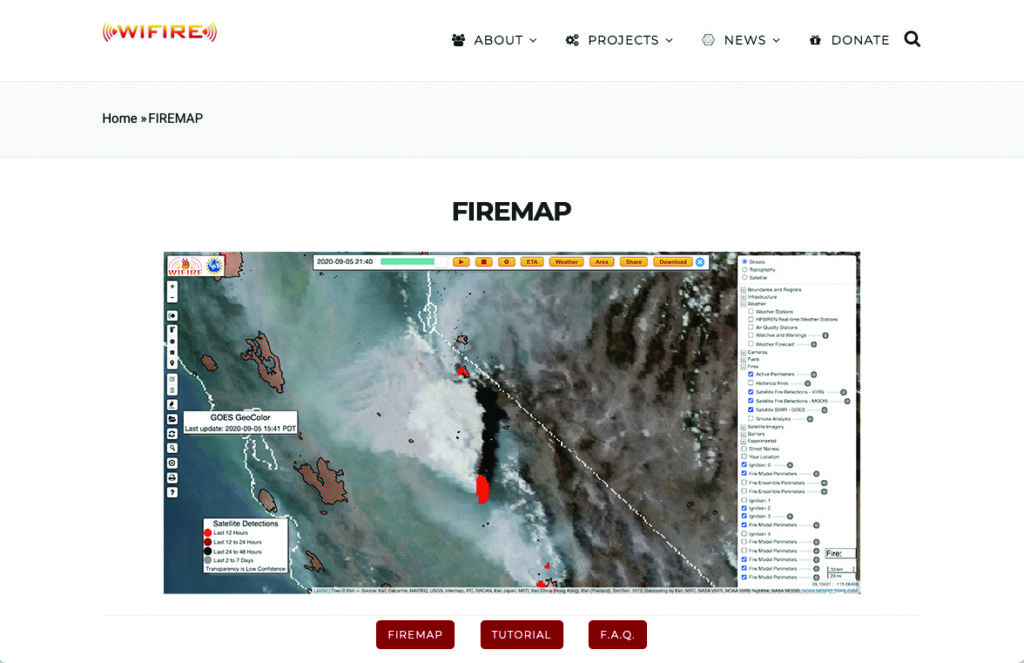
Interagency GIS teams use the Fire Integrated Real-Time Intelligence System (FIRIS) to watch for fire starts and then receive alerts from dispatch centers and satellite imagery. After locating the point of ignition, they create fire behavior models using a program called WIFIRE from UC San Diego. This tool allows them to predict the fire’s probable trajectory and size.
The team will alert the state if the data shows the fire is likely to spread. Hutchinson explains that, within minutes of the start of the Eaton fire, her team produced a fire behavior model that illustrated where the fire was most likely to go and how big it would likely get within the next three hours.
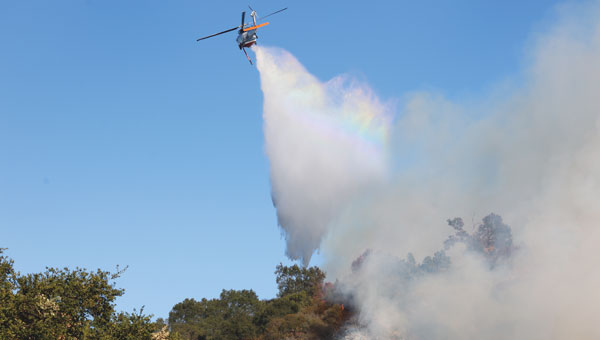
The frequency of IR flights depends on the fire’s size and intensity. Occurring anywhere from once to three times daily, including nighttime, these flights comprehensively map the landscape based on the fire’s specific traits. The decision on how often to fly the planes and collect the IR data depends on the fire’s behavior and potential threat level.
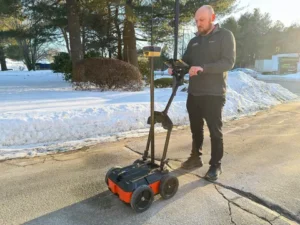
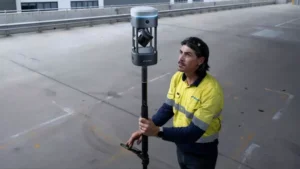
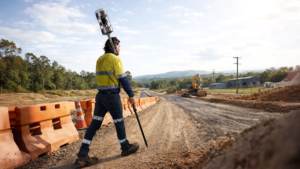
Field observers are also deployed daily to collect data down to the debris. They walk the fire’s edge and move along specific paths created for wildfire management and containment. Once a fire is contained, GIS specialists try to verify ground truth for the perimeter of the entire fire.
GIS specialists constantly update fire perimeters as they get data from the field and the planes. Once a fire is contained, they create final maps to hand over to the local agencies or the Forest Service.

Most of the data that GIS specialists use to map fires comes from field observers and infrared (IR) thermal imagery. The data is collected by third-party contractors, by CAL FIRE’s Intel shift team, or by the FIRIS program by flying manned aircraft.
IR data and information collected by field observers are then uploaded into the National Incident Feature Service (NIFS) for GIS specialists to use to map fires.
Field observers download the maps onto their devices, go out into the field, and ground truth — physically walking the perimeter of the fire and using GPS on their devices to map the fire boundaries accurately.
Paper maps are good to have “just to get everybody on the same page without having to worry about battery life or the glare while you’re working out in the field,” said Rowland.
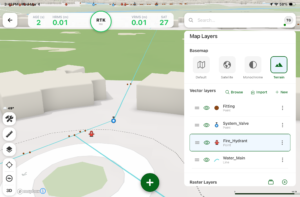
Along with online maps, the Interagency GIS teams print PDF maps for fire personnel in the field. The field observers use Esri ArcGIS Field Maps to record their tracks. They pair their mobile devices with Avenza or other geolocating applications.
Using ArcGIS Pro, GIS specialists create online maps and dashboards, which are then distributed in print and/or digitally to the agencies that need them, such as sheriff and police departments and departments of public works. The Interagency GIS teams create different map products for different end users. For example, it works with law enforcement to create evacuation maps and zones. Local public information officers also can distribute these maps or post them on their websites.
Crews also have online access to the maps through wildfire FTP (ftp.wildfire.gov). Crews load data and maps there that contain public information. Many agencies plug into the National Interagency Fire Center (NIFC), where the CAL FIRE team edits and analyzes mobile data.