No audio available for this content.
Electronic warfare techniques, such as GPS spoofing and jamming, are on the rise. With the increasing prevalence of this sophisticated form of warfare, industry experts must be aware of the threats and find ways to manage them to protect daily operations and civilians. It is important to contribute to the conversation about strategies to mitigate these risks.
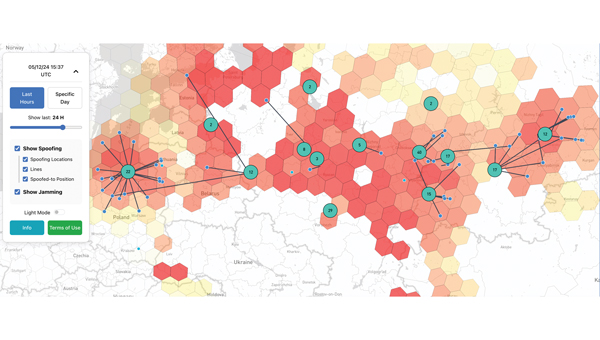
SkAI Data Services has answered the call by creating a live GPS Spoofing and Jamming Tracker Map. The map — available at spoofing.skai-data-services.com — utilizes live ADS-B data from the OpenSky Network to identify and display potentially spoofed aircraft in real time and where GPS jamming activity was observed within the past few hours. SkAI Data Services developed the algorithms with the support of the Zurich University of Applied Sciences — Centre for Aviation.
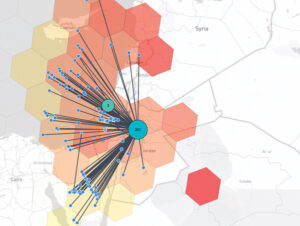
The map displays clusters that indicate areas where spoofed GPS positions of aircraft have been detected. The numbers within each cluster show how many flights were spoofed at that specific location.
The blue markers represent the positions of aircraft just before they were spoofed. The lines connect these real positions to their corresponding spoofed locations. The map also displays areas of potential GPS jamming or radio frequency interference, indicated by colored hexagons. The redder the hexagon, the more jamming was observed. While not all pre-spoofed locations can be detected, increasing the window duration will reveal more lines.
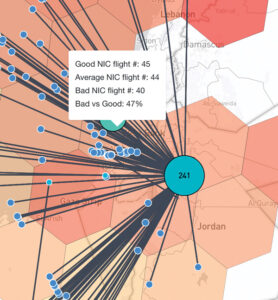
Similar to gpsjam.org, SkAI Data Services uses the reported navigation integrity category (NIC) to identify these zones. Users can hover over the hexagons to see the number of aircraft reporting good NIC (greater than 7), average NIC (between 5 and 7) and bad NIC (less than 5). SkAI Data Services also offers custom API endpoints to integrate jamming and spoofing data into third-party products.