Real-Time Kinematic Spans the Gap


 |
Hong Kong’s Tsing Ma Bridge is the world’s longest span suspension bridge carrying both road and rail traffic. As with other long-span cable-supported bridges, it can move from several centimeters to several meters under different types of loading conditions.
Although these displacements or deformations may not create hazardous conditions for traffic actually on the bridge, as they increase in size, they significantly affect the bridge’s structural integrity and maintenance needs. Real-time measurement accuracy of GPS has improved to centimeter-level precision recently, making it well-suited to monitor variations in three-dimensional bridge motion in response to wind, temperature, and traffic loads. This article describes the layout and technical performance requirements of such a system and discusses the results in bridge structural health monitoring.
The Highways Department of Hong Kong Special Administrative Region designed the Wind and Structural Health Monitoring System (WASHMS) for three large cable-supported bridges, Tsing Ma Bridge, Kap Shui Mun Bridge, and Ting Kau Bridge, in the Tsing Ma Control Area (TMCA) of western Hong Kong. Tsing Ma Bridge measures 1,377 meters across the Ma Wan shipping channel. Built at a cost of approximately HK$7.2 billion (US$925 million), the suspension bridge provides high-speed rail and road connections to Hong Kong’s busy international airport. Ting Kau and Kap Shui Mun bridges, 1177 and 820 meters long, respectively, use cable-stayed construction.
We saw an opportunity to improve the efficiency and accuracy of the existing monitoring system with GPS technology, to monitor the displacements of the main suspension cables, decks, and bridge towers. We use these measured displacement values to derive the relevant stress status acting on major bridge components.
 The three bridges and major highways of western Hong Kong’s Tsing Ma Control Area. |
Displacement of bridge structure serves as an effective indicator of its structural performance condition. We are establishing Finite Element Models (FEM) with reference to GPS measurement for the three bridges; these models will enable us to identify critical structural components, for the purpose of long-term inspection and maintenance.
The real-time GPS On-Structure Instrumentation System (GPS-OSIS) constitutes five sub-systems: the GPS receivers themselves, local and global data acquisition systems, a computer system, and a fiberoptic network. GPS-OSIS improves the efficiency and accuracy of WASHMS monitoring and evaluation activities by:
- 1. reporting displacements, reflecting loading and stress conditions
- 2. providing more information to estimate distribution of stresses/strains in major bridge components
- 3. documenting abnormal loading incidents such as typhoons, earthquakes, traffic overloads, and ship collisions with bridge piers
- 4. detecting damage or accumulated damage in major bridge components
- 5. estimating bridge load-carrying capacities and validating design assumptions and parameters
- 6. providing information for planning and scheduling bridge inspection and maintenance activities.
Overview
Structural design of cable-supported bridges is based on displacements. Displacements or movements of cables, decks, and towers that deviate from the design’s geometrical configurations will redistribute stresses and strains among bridge components, affecting the load-carrying capacity of the whole bridge.
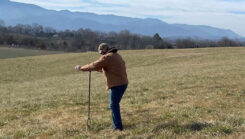
 Receiver atop Tsing Ma Bridge tower, with Kap Shui Mun Bridge in the distance |
Until recently, the WASHMS for Tsing Ma Bridge (TMB), Kap Shui Mun Bridge (KSMB) and Ting Kau Bridge (TKB) consisted of 774 sensors in seven major types: anemometers, temperature sensors, dynamic weigh-in-motion sensors, accelerometers, displacement transducers, level sensing stations, and strain gauges. The commissioning of GPS-OSIS in January, 2001, brought an additional 29 sensors into the overall system. Now fully operational, GPS-OSIS functions as an additional system integral to the existing WASHMS for improving the efficiency and accuracy of bridge health monitoring works.
Although the annual TMCA geodetic survey measures the geometrical configurations of the three bridges, this serves for monitoring geometrical variations due to permanent and long-term structural actions such as dead loads and super-imposed dead loads. Geodetic surveying cannot detect the bridges’ instant responses to transient and variable structural actions such as primary live loads. Before GPS deployment, accelerometers monitored geometrical variations, but this method, due to uncertainties or unknown integration constants, only provides relative local displacements at measurement locations, and does not give overall absolute displacements.
This difference becomes very important in the case, for example, of a strong wind swaying the bridge deck alignment steadily to one side, or daily temperature variation raising or lowering bridge deck level, and sustaining these changes over a period of time before returning to normal position. Accelerometers cannot detect such continuous or steady displacement of the massive deck, only instant local vibration, and they do not give an overall true or absolute displacement. Their limitation in detecting slow global displacement would introduce error in mathematical derivations.
 Bridge Acronyms |
History. During the initial WASHMS design stage in 1992, we considered other measuring technologies such as infrared and laser for displacement monitoring. As these required visibility over a definite distance and could not operate fully under severe weather conditions, we dropped them from consideration. We also considered and then dropped GPS, due to its less than requisite accuracy at that time.
As real-time accuracy of post-Selective Availability GPS for survey application has improved to approximately 20 millimeters vertically and 10 millimeters horizontally, the Highways Department (HyD) of Hong Kong Special Administrative Region (HKSAR) re-investigated GPS use for monitoring the bridges’ geometrical configurations. The reported suitability of GPS as an all-weather system also became an important factor in its adoption. This has yet to be fully demonstrated, although the impending typhoon seasons should put it to the test.
The Case for GPS-OSIS
In the past, level sensing stations and servo-type accelerometers monitored bridge responses in TMCA. The level sensing stations, at a sampling rate of 2.56 Hz, provide real-time monitoring of displacements, with a measurement accuracy of approximately 2 millimeters at typical deck sections at vertical planes only. These level sensing stations are used only on the TMB and KSMB, but not on TKB because the installation cost of pipeline systems along the bridge would be high (a level-sensing system measures pressure changes in sensors installed along a network of flexible hoses). However, they cannot measure the lateral and longitudinal displacements of the deck sections in the horizontal plane.
 Figure 1 GPS-OSIS structure |
High precision servo-type accelerometers monitor the local vertical, lateral and rotational accelerations of the decks, cables and bridge-towers of TMB, KSMB and TKB. Displacement monitoring requires double-integration of the measured acceleration data to determine the three-dimensional motions of the three cable-supported bridges. Because the natural frequencies of the decks are of very low values, double-integration of their acceleration data cannot reflect actual displacement values.
After trial tests on TMB in 1999 and 2000 demonstrated GPS applicability and the required accuracy level, HyD decided to employ GPS with Real Time Kinematic (RTK) function to monitor displacements of the three cable-supported bridges. GPS-OSIS monitors real-time motions of the main suspension cables, decks, and bridge towers of TMB, KSMB, and TKB, derives the relevant stress status acting on the major bridge components, and works with other WASHMS instrumentation systems to monitor overall bridge health and schedule inspections and maintenance activities.
System Description
Figure 1 shows the five major system components. The GPS sensory system consists of two base reference stations and 27 dual-frequency, 24-channel, carrier-phase rover stations, collecting data at a 10 Hz sampling rate, with position latency less than 0.03 seconds.
 Figure 2 Location of GPS rover receivers on Tsing Ma Bridge |
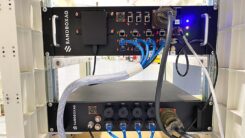
The local data acquisition system consists of three junction cabinets with fiberoptic multiplexers, one on each bridge. One cabinet with fiberoptic multiplexers in the bridge monitoring room constitutes the global data acquisition system. The GPS computer system comprises two workstations and a custom software
system. The fiberoptic network includes 6.5 kilometers of single mode fiber and 18 kilometers of multimode fiber.
Real-time bridge monitoring with up to centimeter-level precision has a time delay of approximately two seconds for display of bridge motions in the monitoring room due to data transmission, processing, and graphical conversion times. As an integrity monitoring system, two base reference stations monitor the quality of the RTK correction broadcast and RTK performance, including GPS availability and geometry. GPS-OSIS operates 24 hours a day with automatic control for data acquisition, processing, archiving, display, and storage. Post-processing the GPS data with relevant data from other WASHMS sensors provides the structural evaluation needed by HyD engineers.
Receiver Location
We installed the rover receivers on bridge locations where we expect to see maximum displacements: at the edges of deck sections at midspan and quarterspans, where applicable, and at towertops. Figure 2 shows TMB rover locations and measured displacements. Table 1 shows normal bridge displacements.
 Figure 3 Location of GPS rover receivers on Kap Shui Mun Bridge |
Most GPS receivers are adjacent to level sensing stations or to accelerometers, so that we can compare the GPS results with data from other sensors.
The reference stations carried choke-ring antennas with radomes to reduce interference, RF jamming, and vibration. Because of size and weight considerations, rover positions used micro-band antennas. To reduce signal interference from physical obstruction, we mounted all rovers with view angles greater than 15 degrees, taking care to avoid obstructions caused by doubledecker buses and high-body vehicles running in the slow vehicle lane closest to bridge edges.
TMB receivers. Four pairs on deck, one pair on main cables, one pair each at Tsing Yi and Ma Wan towertops;
KSMB receivers. One pair on bridge deck, one pair each at Ma Wan and Lantau towertops;
TKB receivers. Two pairs on bridge deck, one each at Tsing Yi, Central, and Ting Kau towertops
Reference stations. Two base reference stations sit atop the storage building adjacent to the bridge monitoring room.
 Figure 4 Location of GPS rover receivers on Ting Kau Bridge |
GPS-OSIS provides real-time motions of bridge decks at 10Hz, derives the variation in geometrical configuration at centerlines of deck sections and records the time-history motions of the bridges at measuring locations, and performs similar monitoring procedures for the towers.
Position latency in the GPS sensory system is less than 0.03 seconds, significantly better than when we first evaluated GPS systems in 1992. The RTK technique measures bridge displacement even when bridge components move at irregular speed, for instance, the aerodynamic effects under varying wind conditions. To fully monitor bridge structural health, we must be able to see structural response to such conditions (whose time of occurrence is captured by other sensors) within this 30 millisecond timeframe. The "raw" GPS data captured by the RTK GPS meets our basic requirements for real-time displacement monitoring.
Processing and analysis by the computer system takes two seconds, then the system graphically displays the patterns of real-time information as shown in Figures 5 to 8.
Table 1 |
GPS-OSIS Information Communication
The monitoring system must continue to function at full capability under the adverse weather or severe environmental conditions that would validate the bridge structural design. Although it is unlikely that the extreme design conditions would occur frequently during the 120-year design life for the three bridges, a severe storm would induce higher stress/strain in the structural components, bringing them closer to extreme design conditions. The corresponding stress/strain measurement of structural responses in critical structural components can validate the design values of environmental loading and design parameters, confirming the confidence level of safe operation.
For this reason, the stability and reliability of data transfer must meet higher than normal specifications. GPS-OSIS therefore uses a stable, effective fiberoptic network for data transmission. Optical fiber, insensitive to electromagnetic waves and lightning effects, provides high quality and speed of data transmission under bad weather and severe environments such as the strong electromagnetic field generated by high voltage circuits. (High voltage power cables run along the bridge service corridors, in the same cable ladder systems as the fiberoptic cable, on separated, higher level racks.) In addition, advanced fiber transceivers can detect any interruption of data transmission and send an alarm to alert maintenance personnel and provide problem locations.
Each set of receivers uses three asynchronous serial ports for data collection, differential signals transfer, and remote monitoring. Each port has a data transmission rate of 19,200 Baud. Multimode fibers deliver the receiver signals to local data acquisition stations where they are converted to high frequency signals and delivered to the global data acquisition station by high quality single-mode fiber.
 Figures 5 and 6 Screen displays of instantaneous displacements of deck, cables and towertops (above) and time series deck displacements (below) of Tsing Ma Bridge. Photo at top shows receiver on TMB suspension cable at mid span and adjacent post-mounted receiver. |
The longest backbone fiber network, connecting local and global data acquisition centers, extends about 3.5 kilometers. The longest branch fiber network, connecting receivers to local data centers, measures about 1.5 kilometers. Replacing several hundred copper data transmission wires with one single-mode fiber significantly improves data transmission efficiency and simplifies network maintenance.
Processing and Analysis
The fiberoptic network delivers geodetical coordinates from the 27 rover stations synchronously to the GPS computer system. The computer system uses one operational workstation, named GPS-OW, for processing, archiving, storage, and graphical treatment to display the real-time bridge motions. The GPS-OW also handles system operation and controls the GPS receivers, local data acquisition stations, the global data acquisition station, and the fiberoptic network. When a problem occurs or the measured data deviation exceeds pre-set parameters, the system alerts the operator.
A second workstation for analysis, GPS-AW, post-processes the GPS data and works with the other WASHMS sensor data to evaluate current bridge health conditions. These two workstations are both connected with other WASHMS workstations and servers. Should GPS-OW break down, GPS-AW can assume its role to keep the GPS-OSIS operating normally.
Figure 7 Screen display of instantaneous displacement of Kap Shui Mun bridge deck |
Comparison with Level Sensing. To verify GPS-OSIS accuracy and compatibility, the system compares its results with those from the level sensing stations of the Lantau Fixed Crossing – On-Structure Instrumentation System (LFC-OSIS) for TMB and KSMB. Figure 9 shows the vertical displacements from the two systems. The level sensing stations’ sampling rate and accuracy are 2.56 Hz and 62 millimeters respectively. The matching results indicate accuracy and compatibility of GPS-OSIS data to LFC-OSIS.
Applying the Results
GPS-OSIS integrates with other structural analysis software to assess stress status in major bridge components. The bridge health monitoring system currently evaluates the bridges in three aspects: load-carrying capacity, serviceability and durability.
- 1. Load-carrying capacity relates to structural stability and ultimate strength of materials. Estimating load-carrying capacity targets quantification of the bridge’s actual safety capacity, to avoid catastrophic damage.
- 2. Serviceability relates to the deformation, crack and vibration of the bridge under normal loading conditions.
- 3. c Durability assessment focuses on damage to the bridge, causes of damage, and its influence on physical properties of materials.
Figure 8 Time series displacement of Kap Shui Mun bridge deck and towertops |
The WASHMS, including GPS-OSIS, is not required to assist decisionmaking regarding bridge operations because a separate monitoring system produces reference information for operational purposes, for example diverting wind-susceptible vehicles during severe weather conditions.
Bridge Health Monitoring
Wind Load and Response Monitoring. In cable-supported bridge design, wind structure/parameters for stability analysis and windtunnel testing are based on wind data collected by weather observation stations far from the bridge site. Therefore we must observe wind conditions at the site itself to validate design assumptions and parameters. WASHMS wind load and response monitoring has five main steps:
- 1. record wind speeds in three orthogonal directions and responses of accelerations, displacements, and strains;
- 2. extract the parameters of hourly mean winds, three-second gust winds, roughness of terrain, wind directions, wind incidences, wind turbulence intensities, and wind power spectra from the wind data under both typhoon and non-typhoon conditions. These parameters will be compared with the design extreme values for monitoring of wind loading on the bridges;
- 3. plot the instant wind speeds against instant bridge motions at tower tops and mid mainspan deck sections under typhoon conditions. We will compare these plots with similar plots from aeroelastic windtunnel testing for design validation and wind response monitoring;
- 4. plot bridge response spectra under typhoons to determine the mechanical magnification factor or admittance function of the bridge structures;
- 5. c plot the stress demand ratio diagrams in key wind resisting components for wind loading monitoring.
 Figure 9 Comparison of vertical displacement measurement by GPS and level sensory system |
Temperature Load and Response Monitoring. Ambient temperature, wind speed fluctuations, material properties, surface characteristics, and section geometry all affect bridge thermal response. The range of vertical deflection at mid-span of TMB is around 400 millimeters daily and can increase to more than one meter in seasonal variation over the year.
WASHMS temperature load and response monitoring includes temperature measurements (including effective bridge temperatures and differential temperatures in sections of decks, towers, and cables) in air, structural steel sections, stainless steel sheets, concrete sections, and asphalt pavement, and plotting measured temperatures against time and/or bridge displacements at instrumented locations. Then computations predict critical temperature, estimate or calculate thermal-induced stresses in the bridge superstructure, and assess the significance of thermal-induced stresses to serviceability and ultimate load characteristics. GPS-OSIS measures thermal movements in suspension cables, decks, and towers. These results will not only be used in computation of thermal-induced stresses in decks, but also in monitoring the performance of the polytetrafluoroethylene (a material with very low friction coefficient, used to facilitate sliding movement) bearings supporting the TMB and KSMB decks.
Highway Load and Response Monitoring. Traffic jams constitute the major design assumption in deriving the required intensity of vehicular traffic loading for long-span bridges. This in turn relies on the traffic loaded length, which is based on the number of traffic jams formed daily, the position, duration, and vehicle distribution of traffic jams, and some assumptions about traffic flow at traffic jams.
 Towertop receiver on Tsing Ma Bridge |
Traffic load and response monitoring in WASHMS first measures traffic flow and traffic loads using dynamic weigh-in-motion sensors installed on the carriageways. Then the system estimates fatigue damage in key structural components induced by vehicles, based on measured load results and measured response results from strain gauges, level sensing stations, and GPS-OSIS.
Railway Load and Response Monitoring. Two trains travelling in opposite directions can induce a 650 millimeter vertical deflection at mid-span of TMB. Normal highway loadings are fairly nominal in comparison.
The railway trackforms of TMB and KSMB are supported by longitudinal I-girders installed under the deck section cross-frames, distributing railway load to the deck-sections. As there is no bridge sensory system to measure the dynamic train loading, railway load and response monitoring is carried out indirectly with strain gauges installed in the longitudinal I -girders. The strain results then help plot the influence lines induced by each set of multiple-axle loads, and the total trainloading is obtained by superposition of individual influence lines. GPS-OSIS measurements at towertops, cables, and deck sections will significantly improve the accuracy in estimating the structural effects, particularly for fatigue damage, under dynamic train loading.
Cable Force Monitoring. The bridges’ cable systems are the key components for load resistance, particularly for vertical loads. For the TMB suspension bridge, GPS-OSIS measures the displacements of main suspension cables and deck-sections. For the cable-stayed bridges, GPS-OSIS measures the displacements of deck-sections and towers. In both cases, measured net displacements in cables are converted to cable forces and then compared with their design values at both serviceability and ultimate limit states.
Stress Monitoring. Structural design is usually based on structural idealization models, where components are idealized as linear members at section centerlines. If a bridge’s axes of towers and deck deviate from those of idealized models, its load-carrying capacity and internal force distribution may change as well.
 Tsing Ma Bridge spans the Ma Wan shipping channel. |
Structural health evaluation work by GPS-OSIS starts with the input of the derived displacement values to the computerized global structural models, which simulate the global stiffness of the whole bridge. Matrix computations obtain the distribution of internal forces and apply the results to the respective local structural models of key bridge components such as cross-frame and longitudinal truss and connections at deck-tower and at cable-deck, to obtain more detailed information on distribution of stress/strain. Stress/strain distributions in different structural components located at different locations have different distribution patterns under the actions of dead and live loads.
Employing GPS-OSIS for displacement monitoring and other instrumentation systems (LFC-OSIS and TKB-OSIS) for stress/strain and load monitoring can verify load-deformation relationships in key components, and estimate or determine load-carrying capacities and potential damage locations in key structural components.
Conclusion
GPS monitors the motions of key bridge locations in real-time. By measuring these variations in geometrical configurations and incorporating results from other sensors, we can more accurately and reliably monitor and evaluate structural performance and health conditions of major cable-supported bridge components. We can then apply the results to planning and implementing inspection and maintenance activities.
Acknowledgements
The authors wish to express thanks to Mr. Y.C. Lo, Director of Highways, for his permission to publish this paper. We also extend thanks to colleagues in TMCA Division of Highways Department for their cooperation in GPS installation, to the Electrical & Mechanical Services Department for GPS supervision work, to Leica Geosystems Limited for GPS installation work, and lastly to Dr. C.K. Lau, former Deputy Director of Highways, for his support of GPS work in TMCA. Any opinions expressed or conclusions reached in the text are entirely those of the authors. c
Manufacturers
Leica Geosystems AG (Heerbrugg, Switzerland) CRS1500 receivers serve as both rovers and reference stations in the GPS-OSIS, with Leica AT504 choke-ring antennas on the reference stations. The system also utilizes custom GPS software from Leica Geosystems, TC1885 and TC8108 fiberoptic multiplexers from Nova Electronics, and two Silicon Graphics 540 workstations.
;


Subscribe to GPS World
If you enjoyed this article, subscribe to GPS World to receive more articles just like it.


Follow Us